
Figure 5.
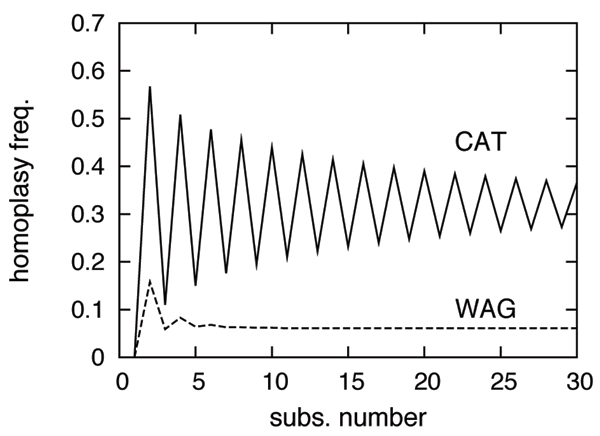
Average probability of return to the initial state, under WAG (dashed lines) and CAT (solid lines), as a function of the number of substitutions.
Official websites use .gov
A
.gov website belongs to an official
government organization in the United States.
Secure .gov websites use HTTPS
A lock (
) or https:// means you've safely
connected to the .gov website. Share sensitive
information only on official, secure websites.
Average probability of return to the initial state, under WAG (dashed lines) and CAT (solid lines), as a function of the number of substitutions.