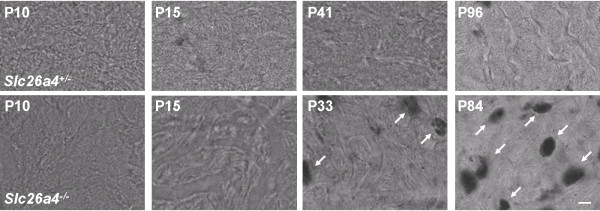
Figure 1.
Hyperpigmentation in stria vascularis. The time course of hyperpigmention during development was determined by laser scanning brightfield microscopy of stria vascularis whole-mounts. Top: images from Slc26a4+/- mice of various ages (P, postnatal day). Bottom: images from Slc26a4-/- mice. Note that hyperpigmentation (arrows) was observed in Slc26a4-/- mice at P33 and P84 but not at P10 or P15. No hyperpigmentation was observed in Slc26a4+/- mice. The scale bar shown in the bottom right image represents 10 μm and pertains to all images in this figure.

