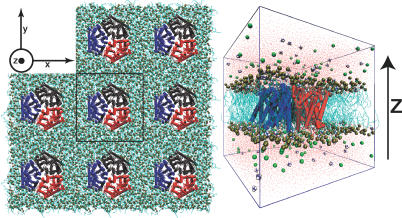
Figure 1. The AmtB Trimer/Membrane/Electrolyte System Setup.
(Left) A top-down view of the simulated system alongside several periodic images. The simulation cell boundaries are drawn in black around the central image. Lipid headgroup phosphorus and nitrogen atoms are shown as orange spheres, and lipid chains are light blue lines. The AmtB trimer is colored by monomer.
(Right) A side view of the central simulation cell. Water is shown as red points, Cl− ions are shown as green spheres, and NH4 + ions are shown in a space-filling representation (nitrogen is blue and hydrogens are white).

