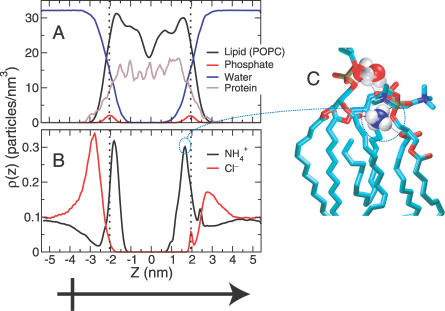
Figure 2. Partial Densities across the Simulation Cell.
Shows the system structure as a function of the transport axis, z (z = 0 coincides with the center of mass of the trimer backbone).
(A) Major system components (lipid, water, and protein). The partial density of the phosphate group is shown as a reference for roughly identifying the boundaries of the membrane. A black, vertical dotted line is drawn at the position of the peak in each leaflet's phosphate density.
(B) NH4 + and Cl− densities. A black vertical dotted line is drawn at leaflet phosphate positions. The average concentration of NH4 + and Cl− in the bulk is “measured” to be 158 ± 5 mM, based on this plot. Cl− binding is enhanced on the cytoplasmic (z < 0) surface and inhibited on the periplasmic (z > 0) surface due to the “external” field created by the channel (dipole moment symbol) as seen from the Cl− density maxima at ∼±2.7 nm. NH4 + binding (see density maxima at ∼±1.7 nm) is not as seriously affected, although its local concentration at ∼±2.7 nm (around the Cl− binding positions) is enhanced near the periplasmic (compared with the cytoplasmic) membrane surface.
(C) NH4 + binding to the membrane surface involves penetration, dehydration, and hydrogen bonding with carbonyl and ester oxygens near the glycerol backbone of lipid molecules as seen in previous work [29].

