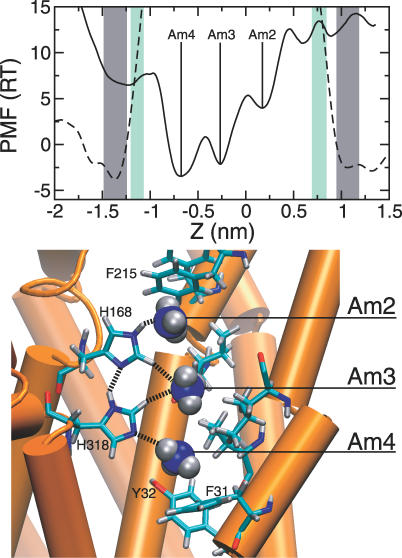
Figure 4. PMF for NH3 Along the Transport Axis.
In units of RT = 2.48 kJ/mol at 298 K (solid black line). The origin is the same as in Figure 2. Am (de)protonation regions are marked with green vertical bars, whose widths give the uncertainty in the regions, and NH4 + binding sites are marked with gray vertical bars. The PMF profile for NH3 (solid line) has been shifted such that its value coincides with that of NH4 + (dashed black line) at the equivalence ((de)protonation) regions (at the center of each green bar). Thus, the free-energy barrier for bringing NH4 + from site Am2 to the periplasmic equivalence point is ∼15 RT units. NH3 binding sites are marked Am2 (z = 0.17 nm), Am3 (z = −0.27 nm), and Am4 (z = −0.68 nm). The free-energy barrier for bringing NH3 (assuming single occupancy) from site Am4 to the cytoplasmic equivalence point is ∼10 RT units. The bound state of NH3 at each of the three sites is shown in molecular detail (bottom panel). All specific interactions within each site are described in the text.

