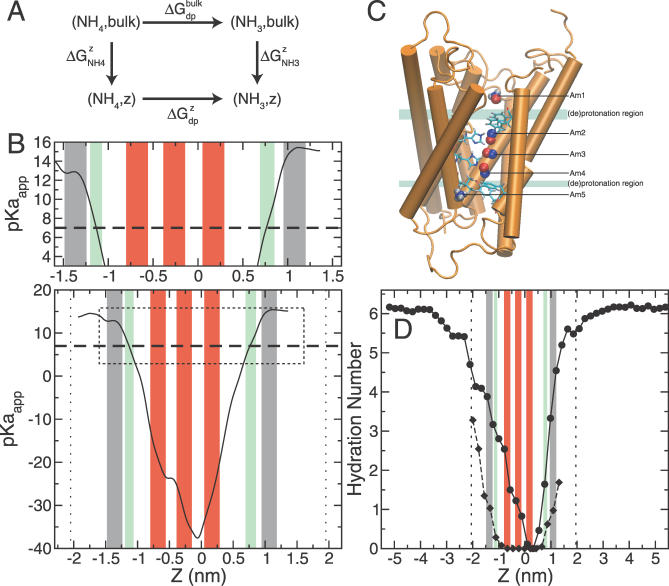
Figure 6. Apparent pKa and Hydration of Am Along the Transport Axis.
(A) Free-energy cycle used to determine pKa of NH4
+ as a function of the transport axis. is the free energy for the alchemical reaction NH4
+ → NH3 in the bulk, far from the membrane, and ΔG
z
dp is the free energy for the same reaction at a particular position, z, along the transport axis.
 is the free energy to bring NH4
+ from the bulk to a particular position, z, and
 is the analogous quantity for NH3.
(B) Apparent pKa (pKaapp) for NH4 + as a function of z for the relevant region of the channel. The top panel shows a closeup of the portion of the bottom panel enclosed in the rectangular box drawn with dashed lines. A large dashed black line marks neutral pH in both panels. Vertical dotted lines (bottom panel) mark the average positions of lipid phosphate groups. As in Figures 3 and 4, gray bars represent NH4 + binding sites, red bars represent NH3 binding sites, and green bars represent (de)protonation regions. The periplasmic (de)protonation region is at z = 0.77 ± 0.08 nm, and the cytoplasmic (de)protonation region is at z = −1.13 ± 0.07 nm. See the text for an explanation of the uncertainties (width of the green bars) in these regions.
(C) Synopsis of binding sites and deprotonation regions generated by multiple structural alignment of AmtB channel structures singly bound at each binding site (a total of five structures taken from umbrella sampling simulations) and the X-ray structure [17]. Some transmembrane helices have been removed from the protein (orange) to allow visibility of the binding sites. The positions of the X-ray sites are shown as red spheres, and Am binding sites derived from our analysis are shown as either blue spheres (in the case of NH3) or blue spheres with white hydrogen atoms (in the case of NH4 +). Any observed differences in the positions of the sites are within fluctuations. (De)protonation regions are marked in green. The periplasmic and cytoplasmic (de)protonation regions coincide with the phenyl groups of F107 and F31, respectively.
(D) Hydration of NH3 (diamonds with dashed line) and NH4 + (circles with solid line) as a function of the transport axis derived by combining statistics from free MD production runs and umbrella sampling runs. The hydration number is defined as the average number of water molecules falling within the first coordination shell of Am. The first coordination shell of Am was taken to be the position of the first minimum in the NAm − Owater pair correlation function (Rcoord = 0.362 nm, see Figure S4).

