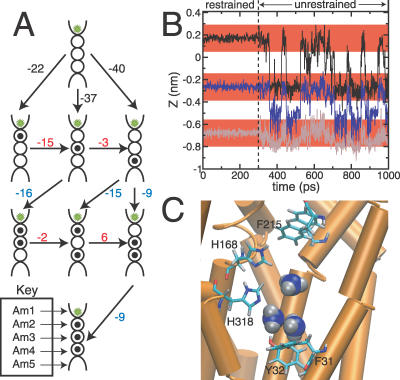
Figure 9. Dynamics and Favorability of Multiply NH3–Occupied Luminal States.
(A) State diagram of all possibly occupied states of the luminal NH3 sites. Each state is shown diagrammatically (from top to bottom, for a single state icon). (1) Site Am1 represented by a concave-up cusp with a green star, representing a reservoir of NH3. (2) sites Am2, Am3, and Am4 are represented by circles. (3) Am5 is represented by a concave-down cusp. Occupied (by NH3) luminal sites are represented by black dots (within the circles representing sites Am2–4). The free energy required for each reaction (arrows) is given in kJ/mol. Black values were determined from the PMF of Figure 4, red values were determined algebraically by completing the embedded thermodynamic cycles, and blue values were determined using thermodynamic integration techniques (see Figure S5 and surrounding discussion).
(B) A demonstration of NH3 dynamics (1 ns) in the lumen. Horizontal red bars represent sites (listed in decreasing value of z) Am2, Am3, and Am4, respectively. For the first 300 ps of the simulation, the NH3 molecules are restrained (in the z-dimension only) to their binding positions. When the restraint is released, NH3 is seen to behave dynamically in the lumen, and there is a strong tendency for NH3 to move toward the site closest to the cytoplasmic end of the channel, site Am4.
(C) A snapshot illustrating the tendency for NH3 to migrate toward site Am4. Here three NH3 molecules have migrated from a state where Am2, Am3, and Am4 are occupied, to a state where one molecule occupies Am3 and two molecules “fight” to occupy site Am4.

