
Figure 6.
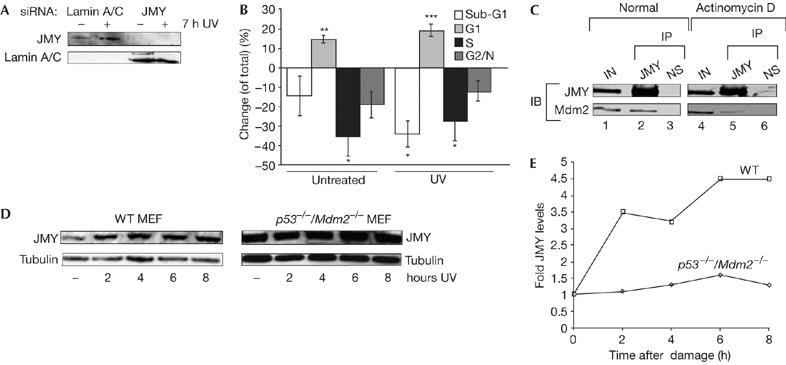
JMY regulation during the DNA damage response. (A) U2OS cells were treated with either JMY or lamin short interfering RNA (siRNA) as indicated. After 72 h, cells were collected followed by immunoblotting with goat JMY antibody L-16 or lamin antibody as indicated. (B) U2OS cells were treated as described with either JMY or lamin siRNA. Seven hours before the collection of cells, they were given either fresh medium or were treated with ultraviolet (UV) light (50 J/m2) and given fresh medium. Cells were analysed by flow cytometry (approximately 20,000 cells). The graph represents the change (expressed as %) in cell-cycle parameters relative to the control lamin siRNA-treated cells. Results represent mean±s.e.m. (n=4 independent experiments). Statistical analysis was performed using the Student's t-test: *P<0.05, **P<0.01, ***P<0.001. (C) U2OS cells were transfected with expression vectors encoding JMY (10 μg) and Mdm2 (10 μg). Cells were left untreated or were treated with actinomycin D (20 nM for 16 h). The cell extracts were immunoprecipitated (IP) with mouse haemagglutinin (HA) antibody (lanes 2, 5) or with mouse Gal4 antibody as a control (lanes 3, 6; NS). Immunoprecipitates were analysed for Mdm2 binding. JMY was detected with a rabbit HA antibody (Y-11) and Mdm2 with the rabbit H-221 antibody. Lanes 1 and 4 show the input (IN; 10% of cell extract). (D) Wild-type (WT) and p53−/−/Mdm2−/− mouse embryonic fibroblasts (MEFs) were treated with UV light (50 J/m2) for the times indicated. Cell extracts were collected and whole-cell extracts were run using 10% SDS–polyacrylamide gel electrophoresis. Endogenous JMY was detected using the goat JMY antibody L-16 and tubulin was used as a loading control. (E) The relative induction of JMY compared with untreated cells. Quantification was performed after normalizing JMY levels compared with loading controls. IB, immunoblotting.