
Figure 4.
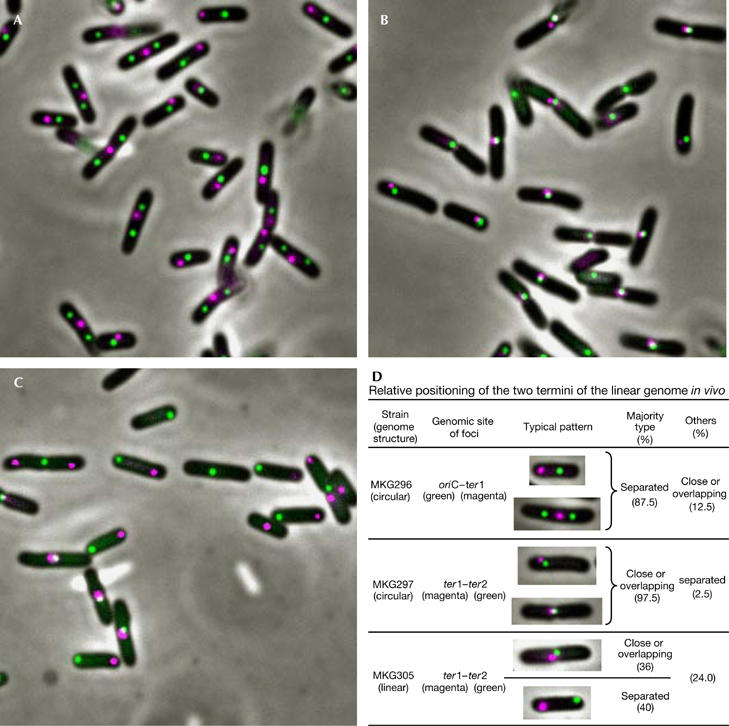
Relative positioning of the two termini of the Escherichia coli linear genome in vivo. For details on the strains and experiments, see text and Methods. (A) Strain MKG296 (circular genome). Relative positioning of oriC (green) and ter1 (red, −20 kb from dif) can be seen. (B) Strain MK297 (circular genome). Relative positioning of ter1 (red) and ter2 (green, +20 kb from dif) can be seen. (C) Strain MK305 (linear genome). Relative positioning of ter1 (red) and ter2 (green) can be seen. (D) Summary table of relative positions of the two foci in each strain. All cells (126 cells of MKG296; 234 cells of MKG297; 189 cells of MKG305 were used) were classified into the following three patterns: two foci are (i) separated, (ii) close or overlapping, or (iii) have other patterns. The percentage of each pattern and the typical principal patterns are shown in the table. oriC, replication origin.