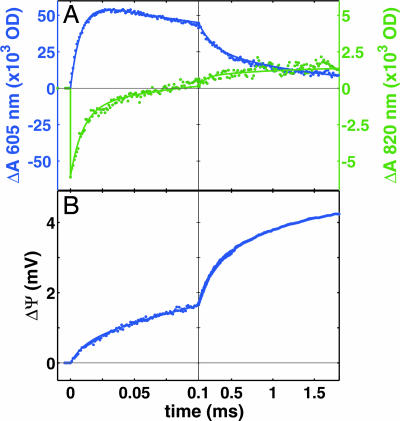
Fig. 2.
Electron and proton transfer kinetics in CcO. (A) The redox kinetics of heme a (blue, reduction upwards) and CuA (green, reduction downwards). The best three-exponential fit (lines) to the data (dots) yields time constants of 10, 150, and 800 μs. (B) The corresponding kinetics of membrane potential formation in vesicles inlaid with CcO. The fit (blue line) to the data (blue dots) with time constants from the optical measurements (10, 150, and 800 μs) requires one more component with a time constant of 2.6 ms. The relative amplitudes of the four phases are 12%, 42%, 30%, and 16% of total. The laser is fired at zero time.

