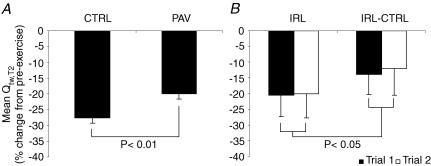
Figure 5.
Group mean change across all stimulus frequencies for the second quadriceps twitch amplitude (Qtw,T2), expressed as percentage change from baseline values, for CTRL versus PAV (A) and IRL versus IRL-CTRL (B). Trial 1 and Trial 2 were performed on different days at identical power outputs and exercise durations for each of the IRL and IRL-CTRL conditions. Data were collected 2.5 min postexercise. n = 8 per group. Values are mean ±s.e.m.

