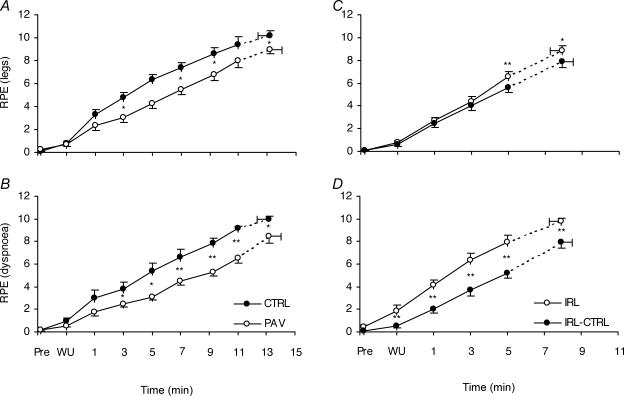
Figure 7.
Ratings of perceived exertion (RPE) for limb discomfort (top panels) and dyspnoea (bottom panels) are shown for PAV versus CTRL (A and B) and IRL versus IRL-CTRL (C and D). n = 8 per group. Values are mean ±s.e.m.*P < 0.05; **P < 0.01, significantly different from corresponding time value. Note: the IRL and IRL-CTRL values are the mean of two trials performed on different days.

