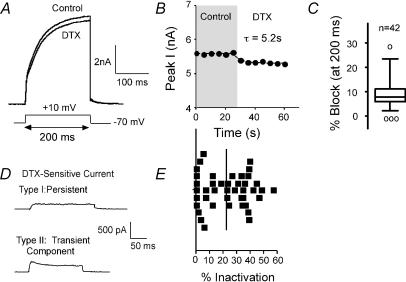
Figure 4. Currents sensitive to α-dendrotoxin (α-DTX).
A, α-DTX (DTX) blocked a portion of the current elicited by steps to +10 mV from −70 mV. B, plot of current versus time for cell shown in A. The effect of α-DTX was rapid (τ of 5.2 s in this cell). C, box plot shows variability in response to α-DTX in 42 cells (test step as in A). Line in box indicates median. Outer edges of box represent inner quartile and whiskers indicate outer quartile for data. ○, outliers (Tukey, 1977). D, examples of α-DTX-sensitive currents (at +10 mV) from two different cells. The upper cell showed rapid activation and little inactivation over the 200 ms step. The lower cell exhibited both transient and persistent components. E, scatter plot shows distribution of percentage inactivation over the 42 cells included in C. Vertical line indicates mean value.

