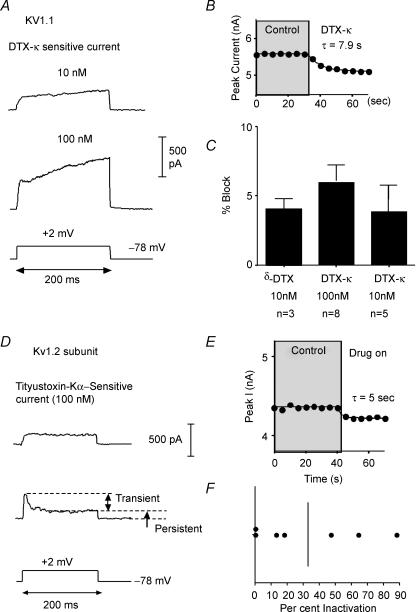
Figure 6. Specific peptide toxins for Kv1.1 and Kv1.2.
A, representative traces for current sensitive to dendrotoxin-K (DTX-K) at 10 nm (upper) and 100 nm (lower). Note initial fast activation and subsequent slow rise of current with time. B, plot of peak current versus time illustrating that DTX-K onset was rapid. C, bar graph (mean ±s.d.) illustrating the percentage of whole cell current (at 200 ms) blocked by DTX-K or δ-DTX. D, representative traces for current blocked by the Kv1.2-specific toxin, r-tityustoxin-Kα (TiTX). The upper trace was from a cell where the TiTX activated rapidly and inactivated very little over the 200 ms test step. The lower trace is from a cell where both transient and persistent components of the TiTX-sensitive current were present. E, plot of peak current versus time showing that the TiTX block was rapid in onset. F, scatter plot of percent inactivation for 7 cells tested with TiTX (10 nm). Vertical line = mean value.

