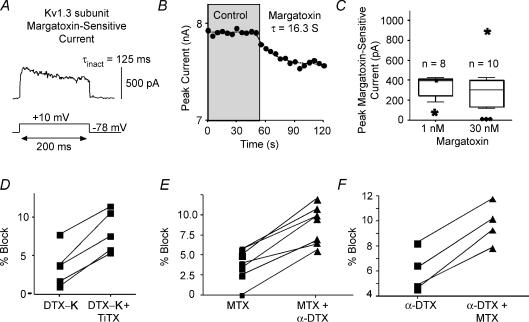
Figure 7. Specific peptide toxin for Kv1.3 and combined toxins.
A, representative trace for current sensitive to r-margatoxin (MTX). B, plot of peak current versus time indicating the rate of block by MTX. C, box plots illustrating the distribution of responses to 1 nm or 30 nm MTX. D–F, scatter plots indicating response of cells to combinations of toxins. D, in these cells, DTX-K (10 nm) initially blocked current. In all cells, additional current was blocked by the combination of DTX-K and TiTX (100 nm). E, MTX (1 nm) blocked current. In all cases, α-DTX (500 nm) blocked additional current. F, α-DTX (500 nm) blocked current. In all cases, additional current was blocked by the combination of α-DTX plus MTX (1 nm).

