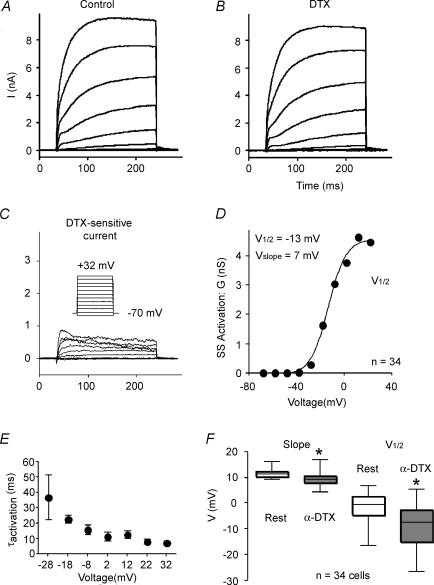
Figure 8. Activation of the α-DTX-sensitive current.
A, series of current traces control solution in response to 200 ms voltage steps from −78 mV to various potentials between −70 mV and +32 mV. B, similar family of currents after application of 100 nmα-DTX. C, α-DTX-sensitive currents obtained by subtracting traces in B from those in A. Inset: voltage protocol. D, steady-state activation curve for cell shown in A–C. E, population data for activation time constant (τactivation) as a function of test voltage (n = 19 cells). F, box plots comparing the half-activation voltage (V½) and slope for Boltzmann fits of activation curves for the α-DTX-sensitive and α-DTX-insensitive currents.

