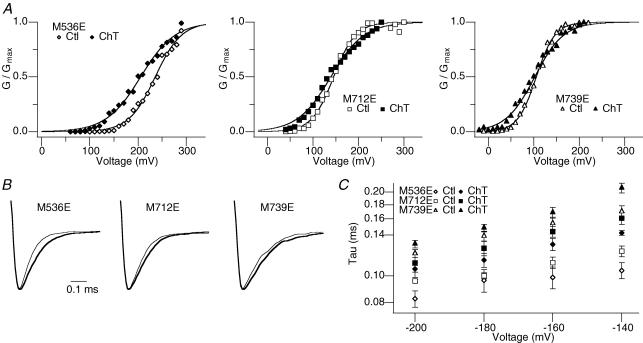
Figure 6. Substitution of M712 or M739 with glutamate mimics oxidation.
A, representative M536E (left), M712E (middle), and M739E (right) G–V curves before (open symbols) and after (filled symbols) treatment with Ch-T. See Table 3 for mean ±s.e.m. values; n = 5. B, M536E (left), M712E (middle), and M739E (right) scaled tail currents recorded at −200 mV after pulses to 180 mV before (thin sweep) and after (thick sweep) Ch-T modification. C, voltage dependence of the deactivation time constant for M536E (diamonds), M712E (squares), and M739E (triangles) before (open symbols) and after (filled symbols) application of Ch-T. See Table 4 for mean ±s.e.m. values.

