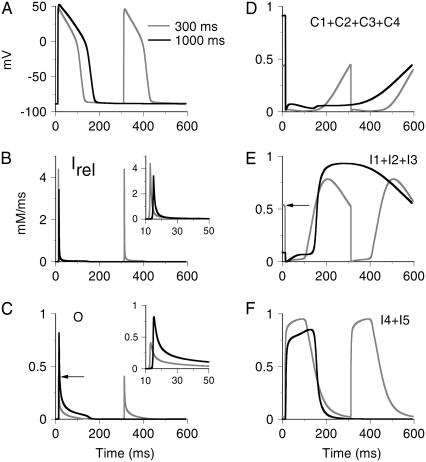
FIGURE 13.
State residencies of the RyR channel during the time course of the action potential for two different pacing frequencies, CL = 1000 ms (black curve) and CL = 300 ms (gray curve). For identification of the channel states, refer to Fig. 2 B.

