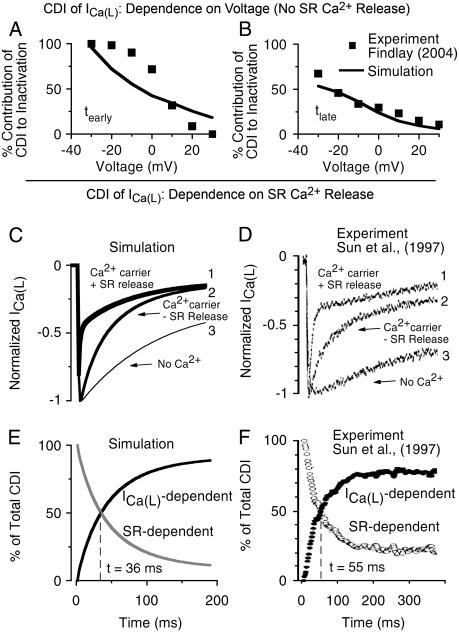
FIGURE 6.
(A and B) Voltage dependence of the contribution of CDI to total inactivation for two different times (early, tearly; late, tlate) after application of a voltage step to varying potentials from a holding potential of −80 mV. The plotted values are the ratio of current decay recorded with Ca2+ as the charge carrier relative to that recorded with Ba2+ as the charge carrier. Experiments (from Findlay (55), with permission) (▪) were conducted at room temperature (23°C) and simulations (solid line) at 37°C; values of tearly and tlate were adjusted for 37°C in the simulations. (Experiment: tearly = 20 ms, tlate = 200 ms; Simulation: tearly = 8 ms, tlate = 80 ms). (C–F) Relative contributions of Ca2+ through the channel and Ca2+ released from the SR to total CDI during a voltage step. (C) Trace 3 (thin curve) shows simulated ICa(L) in the absence of Ca2+-dependent inactivation, corresponding to current carried by monovalent cations or Ba2+, for a voltage step from −80 to −10 mV. Trace 2 (medium curve) shows ICa(L) with Ca2+ as the charge carrier (hence with Ca2+-dependent inactivation) but with no Ca2+ release from the SR (Irel = 0) for a voltage step from −80 to 0 mV (the 10-mV difference in test potential compared to trace 3 is to reproduce the experimental protocol in panel D for comparison). Trace 1 (thick curve) shows ICa(L) for the same square pulse with Ca2+ as the charge carrier and SR calcium release intact. (D) Experimental recordings of ICa(L) in human atrial myocytes measured at room temperature. Trace 3 is the current through the channel utilizing monovalent cations as the charge carrier tested with a voltage step from −80 to −10 mV. Trace 2 shows ICa(L) with Ca2+ as the charge carrier but with SR release blocked with ryanodine during a voltage step from −80 to 0 mV. Trace 3 shows ICa(L) with Ca2+ as the charge carrier and SR release intact for the same voltage step. (E) Simulated fraction of Ca2+-induced inactivation that results from Ca2+ released from the SR (gray) or from Ca2+ entering via ICa(L) (black). The formula for determining the relative contribution is from Sun et al. (8) where the ICa(L) dependent fraction = (trace3 − trace2)/(trace3 − trace1) and the SR dependent fraction = (trace2 − trace1)/(trace3 − trace1). (F) Experimental fractional contribution of ICa(L)-dependent (black) and SR dependent (white) Ca2+-induced inactivation of ICa(L). Experimental curves in panels D and F are reproduced from Sun et al. (8), with permission.

