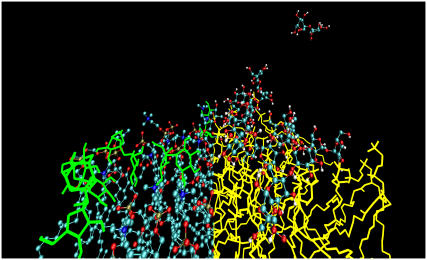
FIGURE 3.
The MD simulations. Snapshot taken from an MD simulation of a DOPC bilayer with 0.8-M sucrose system after 100 ns. Only one of the leaflets of the bilayer is shown. For clarity, the sucrose molecules are presented in green on the left side of the figure, whereas the lipids are presented as ball and stick, with the carbon atoms shown in blue, the oxygen atoms shown in red, and the hydrogens in white. Only hydrogens capable of forming hydrogen bonds are shown. On the right side of the figure, the lipids are presented in yellow and the sucrose in ball and stick representation.

