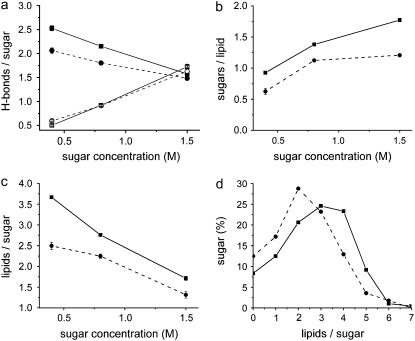
FIGURE 6.
Hydrogen-bond analysis. (a) The average number of hydrogen bonds between the sugar molecules and the lipids (solid symbols) or between sugar molecules (open symbols) for sucrose (▪, □) and trehalose (•, ○). (b) The average number of sucrose (▪) and trehalose (•) molecules that formed hydrogen bonds with a lipid. (c) The average number of lipids that formed hydrogen bonds with a sucrose (▪) or trehalose (•) molecule. (d) Distribution of the number of lipids that bound to a sucrose (▪) or trehalose (•) molecule (for 0.8 M of sugar).

