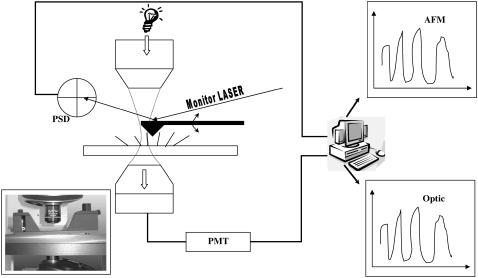
FIGURE 1.
Schematic view of the measurement setup. The system consists of two different subsystems, measuring simultaneously and colocally the live cilia tissue. The electrooptic subsystem consists of a halogen white lamp, concentrated by an objective to a spot on the cilia, a second objective that collects the light scattered by the cilia while passing through the tissue; a part of the light, corresponding to a round area with a diameter of ∼5 μm is subsequently collected by an optic fiber in the intermediate image plane of the second objective, converted by a photomultiplier tube, and fed to a digital data acquisition card connected to a personal computer. The AFM consists of a flat scanner, allowing a free optical axis above and below the sample, an AFM probe dipped into the field of beating cilia (imaged continuously by the microscopes); the Z motions resulting from collisions of the cilia with the AFM probe are monitored by a laser beam (680 nm) focused on the back of the AFM cantilever, which is reflected onto a position-sensitive detector (PSD). The output of the PSD is amplified and fed to the data acquisition card, on a different channel. During the measurement, a data acquisition program acquires both signals (Optic and AFM) at a sampling frequency of 250 Hz, displays them and their power spectra as calculated by an FFT routine, in real time, and saves the data for further processing and analysis on a hard disk.

