FIGURE 2.
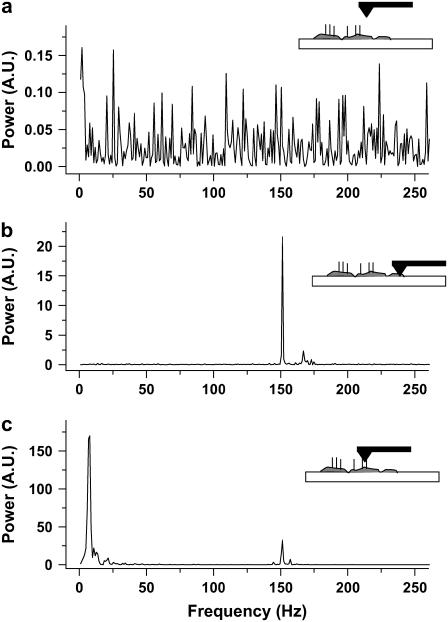
FFT power spectra of AFM measurements. Power is reported in arbitrary units (A.U.) (a) The AFM probe is in the Ringer solution far above the cilia, the measurement is of the noise only. There is no dominant frequency in the range of frequencies measured. (b) The AFM probe in contact with a monolayer of ciliary cells but bereft of cilia. There is a large peak at ∼150 Hz. This frequency is typical of contact between the probe and any sample in our system and originates in a mechanical resonance. (c) The AFM probe is in contact with beating cilia. The peak around frequency 150 Hz appears here, too, with similar power to that in b. The peak at 8 Hz is around eight times larger than the peak at 150 Hz, and is identified as resulting from interaction between the cilia and the AFM probe. Therefore, when measuring active cilia (8-Hz peak), the AFM probe is in direct contact with the ciliary tissue (150-Hz peak).

