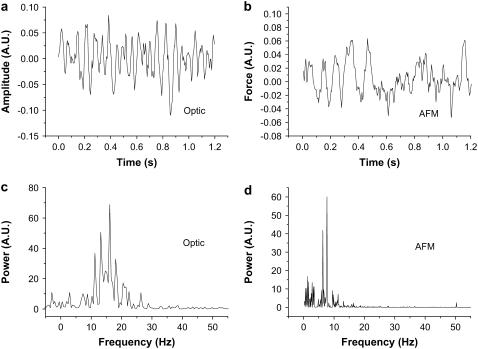
FIGURE 3.
Optic and AFM measurement of cilia. (a and c) The optical signal, acquired on a sample beating with a relatively high-frequency (∼15 Hz) raw signal and power spectrum, respectively. (b and d) AFM signal acquired from a different sample, beating at a lower-frequency (∼8 Hz) raw signal and power spectrum, respectively. It is demonstrated that the FFT power spectrum faithfully reports the different frequencies (visually compare the raw signals in a and b), both for the optical and AFM signals, despite the fact that the raw signal is less than periodical. The fluctuations in amplitude are typical of these cilia.

