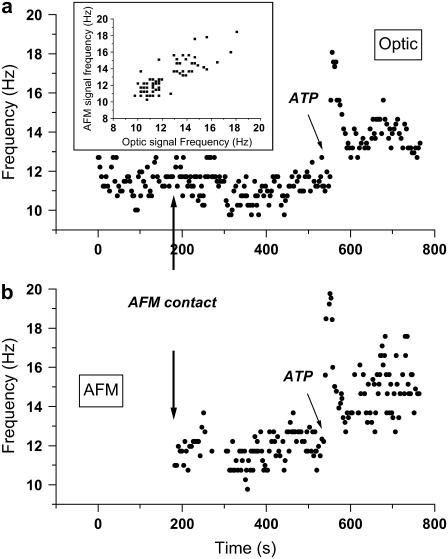
FIGURE 4.
Simultaneous and colocal measurement of the optic and AFM signal frequencies before, during, and after approaching the cilia with the AFM probe. (a and b) Optic and AFM measurements of frequency, respectively. Contact of the AFM probe with the sample occurs ∼180 s after start of acquisition of the optic signal, indicated by arrows in both a and b. No change in the frequency of the optical signal (a) is observed. Extracellular ATP was added ∼550 s from the start of the experiment, causing a rapid increase in the frequency, followed by a gradual decrease, and was recorded simultaneously by the optical system and AFM. The inset shows a plot of the frequency of the AFM signal versus the frequency of the optic signal and demonstrates the good correlation between the simultaneously acquired signals. This proves unequivocally that the AFM signal originates in the cilia.

