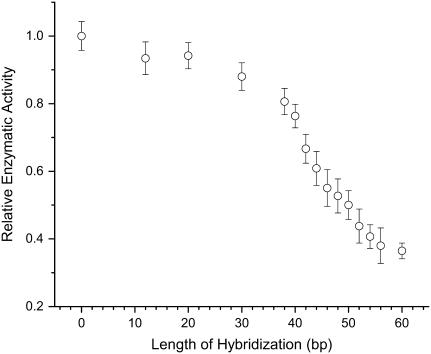
FIGURE 4.
Force-activity curve. This plot shows the response of the protein to increasing mechanical stress. The enzymatic activity (REA) of the GK chimera is plotted versus the length L of the complementary DNA added in solution (i.e., L is the length in bp of the hybridized segment of the ASP). Each point represents the average of four to five independent measurements; the error bars are ±1 SD. The data point L = 12 is also a control; the DNA strand added in solution in this case is actually a 60mer, but only 12 bases are complementary to the DNA of the chimera. This control 60mer sticks to the chimera but does not provide mechanical tension.

