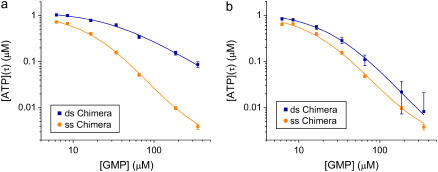
FIGURE 6.
GMP titration experiments. Enzymatic activity (ATP consumption) is monitored with the luciferase assay. We plot the concentration of ATP remaining after a time τ, [A(τ)], versus the initial GMP concentration [G(0)], for the ss and ds chimera. [A(τ)] is a measure of the speed of the enzymatic reaction. Each experimental point represents the average of four to six measurements; error bars are ±1 SD. The ss data are fitted using Eq. 6, the ds data using Eq. 9, with the ss parameters determined by the ss fit. The parameter values extracted from the fits are listed in Table 1. (a) Hybridization with L = 60 (“high tension”). KG is reduced by a factor of 10 under tension (see Table 1). (b) Hybridization with L = 42 (“moderate tension”), corresponding to roughly the midpoint of the force-activity curve (Fig. 5). KG is reduced by a factor of 5.

