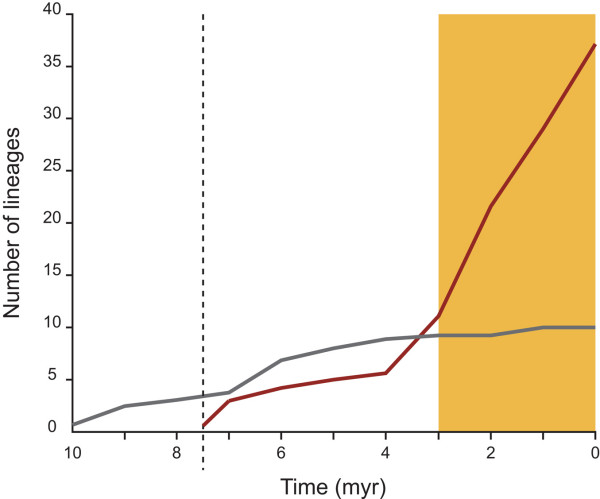
Figure 3.

Lineage by time diversification plot. The plot shows differential rates of gall-thrips diversification that specialise on either Plurinerves (red line) or Juliflorae (grey line). The gold rectangle indicates the Quaternary period and a dotted line that indicates the inferred host switch to a Plurinerves ancestor. Lineage frequencies were counted using the Penalised Likelihood chronogram (Figure 2).
