
Figure 1.
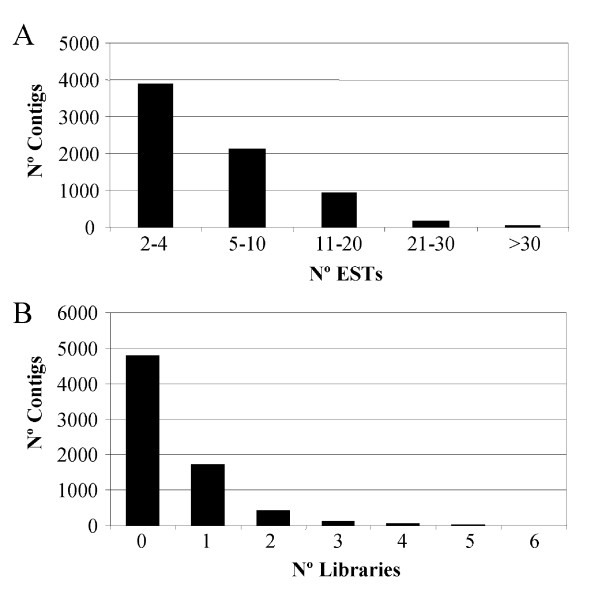
EST assembly results. A – Distribution of ESTs incontigs. B – Number of contigs containing ESTs from 1 or more cDNA libraries.
Official websites use .gov
A
.gov website belongs to an official
government organization in the United States.
Secure .gov websites use HTTPS
A lock (
) or https:// means you've safely
connected to the .gov website. Share sensitive
information only on official, secure websites.
EST assembly results. A – Distribution of ESTs incontigs. B – Number of contigs containing ESTs from 1 or more cDNA libraries.