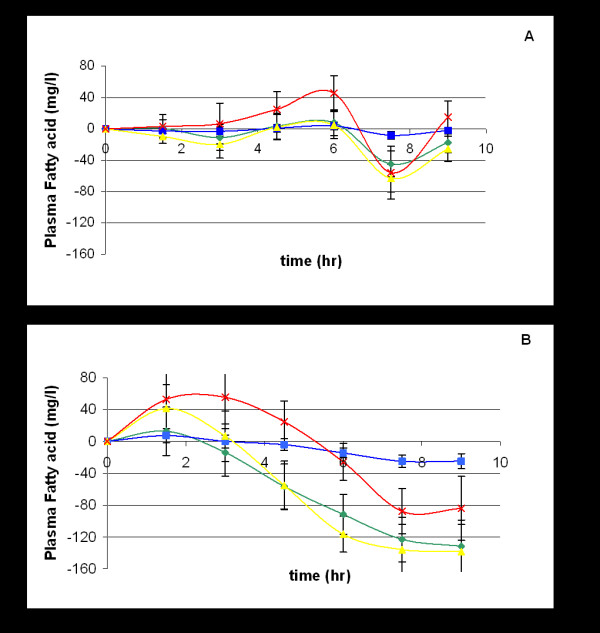
Figure 3.

Plasma fatty acid concentrations for oil (A) and emulsion (B) groups. Data given as mean for concentration of individuals (n = 22) at each time point. A – oil group; B – emulsion group. -◆- (green) palmitic acid; -▪- (blue) stearic acid; -▲- (yellow) oleic acid; -x- (red) linoleic acid. SEM – standard error of the mean; n – number of subjects.
