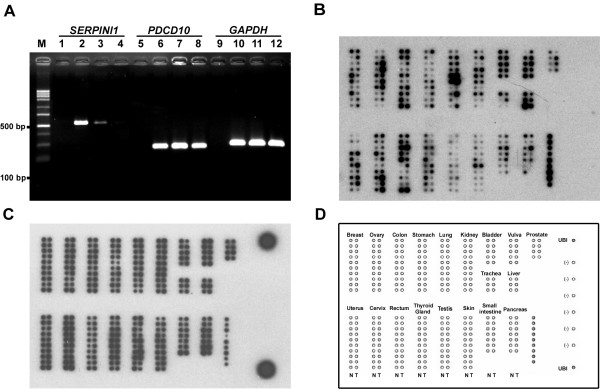
Figure 2.
Relative expression levels of SERPINI1 and PDCD10 between normal and tumorous tissues. A) Semi-quantitative RT-PCR analysis of SERPINI1 and PDCD10 transcripts. RNAs used in this study were obtained from the normal human brain (Lanes 2, 6 & 10), human neuroglioma H4 cells (Lanes 3, 7 & 11) and human glioblastoma U-87 MG cells (Lanes 4, 8 & 12). M indicates the DNA size markers; and Lanes 1, 5 & 9 are the negative controls without templates in the PCR reactions. B & C) Northern hybridization analysis of PDCD10 (B) and ubiquitin (C) in paired normal/tumor tissue samples (BD Clontech). The array order of all tissues examined is shown in panel D.

