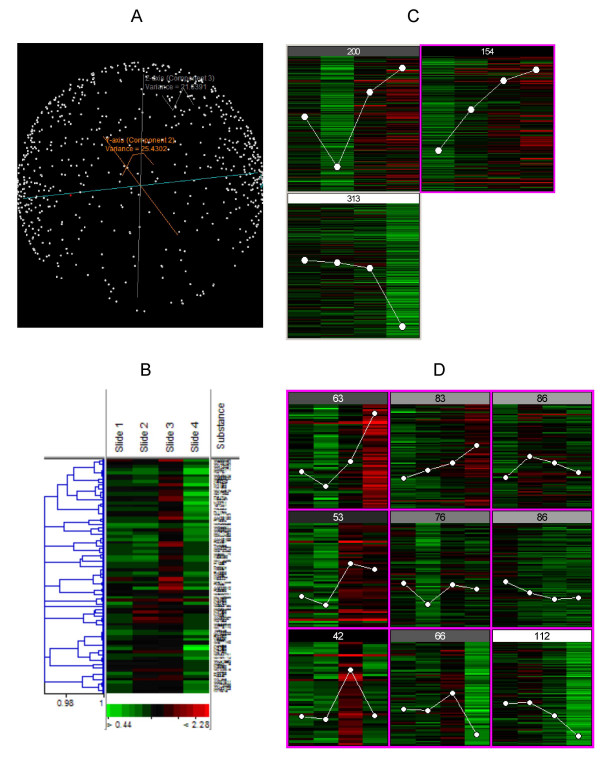
Figure 4.
Visualizations generated from the following clustering algorithms: (A) Principle component analysis (PCA), (B) Hierarchical, (C) K-means, (D) Self-organizing maps (SOMs). Each image depicts the results of a specific clustering algorithm applied to the same set of genes, approximately 700 genes. The data shown was generated from cDNA microarrays hybridized with human cells grown under varying conditions. Each algorithm segregates the data differently, based on specific parameters and conditions.

