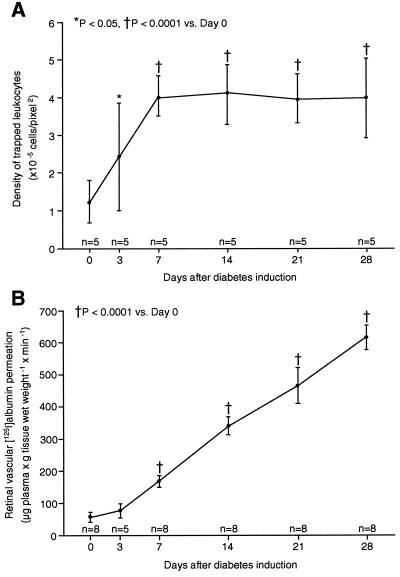
Figure 1.
Time course of diabetic retinal leukostasis and vascular leakage. (A) Leukostasis was quantified serially by using AOLF. Nondiabetic animals (day 0) and animals with streptozotocin-induced diabetes of varying duration were studied. (B) Radioactive albumin permeation into retinal tissue was quantitated at the same time points by using the isotope dilution technique. All data show the means ± SD.

