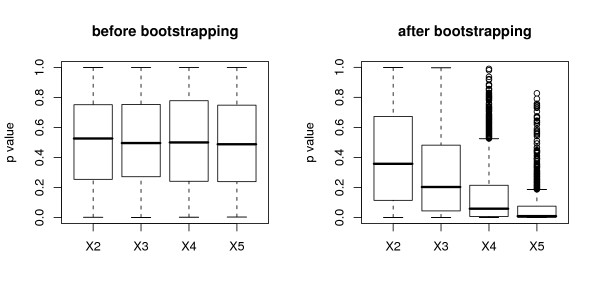
Figure 11.
Effects induced by bootstrapping. Distribution of the p values of χ2 tests of each categorical variable X2,..., X5 and the binary response for the null case simulation study, where none of the predictor variables is informative. The left plots correspond to the distribution of the p values computed from the original sample before bootstrapping. The right plots correspond to the distribution of the p values computed for each variable from the bootstrap sample drawn with replacement.

