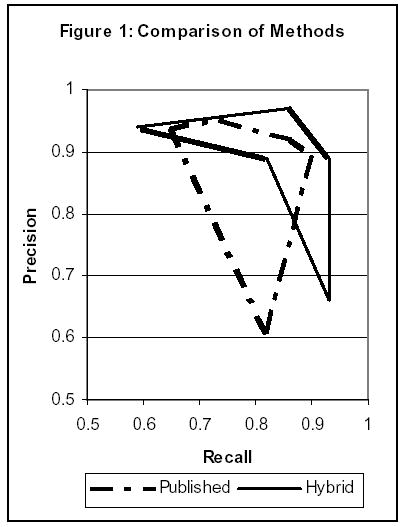
Figure 1.

Graphs representing the overall results between the two sets of methods, published and hybrid. Inflections in the graph representing hybrid methods may not exactly match the results in Table 2 due to merging of redundant data points. The hybrid graph represents data points in the incremental methods, as well as the combined results of the “voting” methods.
