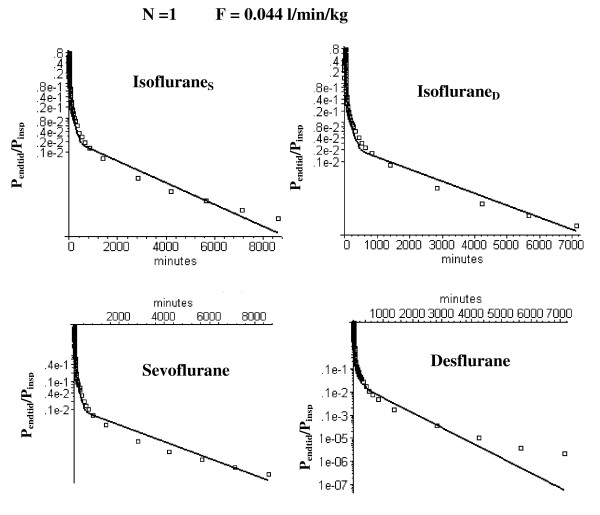
Figure 5.
Semi log plots of comparison of the long time washout data (squares) versus the N = 1 PBPK model (solid line) using the optimal value of FT (= 0.044 l/kg/min) determined from the short time modeling analysis (fig. 3). Results are shown for data from the two studies by Yasuda et. al. in which sevoflurane and isoflurane (= IsofluraneS) [5] were compared and desflurane and isoflurane (= IsofluraneD) [4] were compared.

