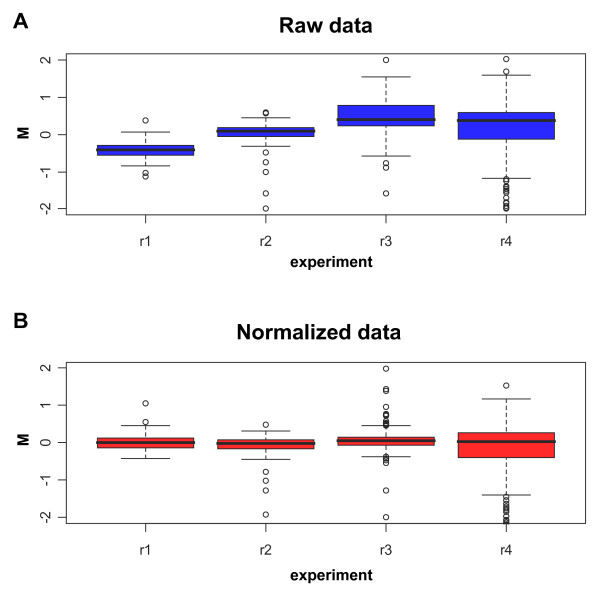
Figure 1.

Box plots of the expression log-ratios (M-values) of spike genes of four replicates (r1–r4). Each box corresponds to one array where the amount of spike RNA on both channels is 250 pg. (A) Box plots before normalization (i.e. only background subtracted M-values of raw data). (B) Box plots after normalization (i.e. loess normalized M-values).
