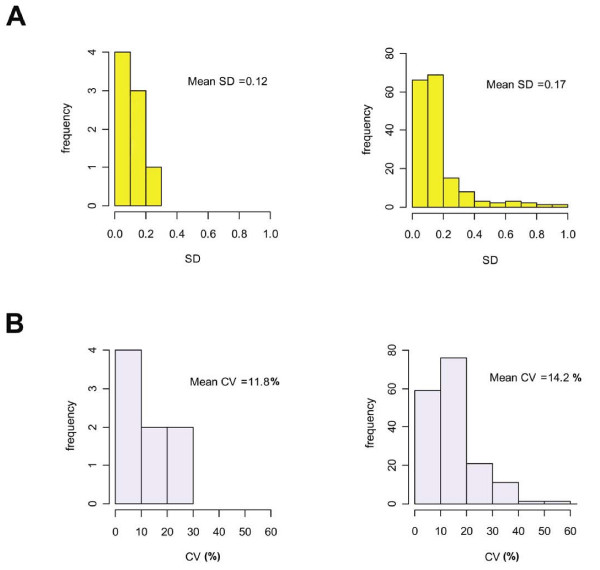
Figure 4.

Array data reproducibility. (A) The histograms represent the distribution of the standard deviations (SD) of M-values of technical repeats for the spikes (left side) and for the experimental genes (right side). The mean SDs of the repeated measurements of each group are shown. (B) The histograms represent the distribution of the coefficients of variation (CV) [(SD of M-values × 100)/mean of M-values] of technical repeats for the spikes (left side) and for the experimental genes (right side). The mean CVs of all repeated measurements of each group are shown.
