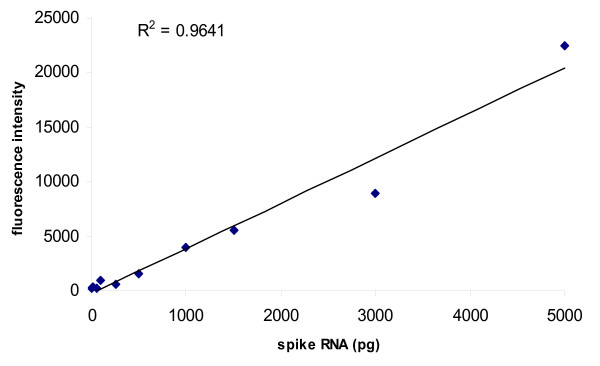
Figure 5.

Detection limit of spiked RNA samples. 15 μg of total RNA were spiked with spike RNAs at increasing concentrations: 5 pg, 10 pg, 50 pg, 100 pg, 250 pg, 500 pg, 1000 pg, 1500 pg, 3000 pg and 5000 pg. The mean fluorescence intensity was plotted as a function of transcript concentration. The black line represents the linear regression calculated by the least squared method (R-squared = 0.9641).
