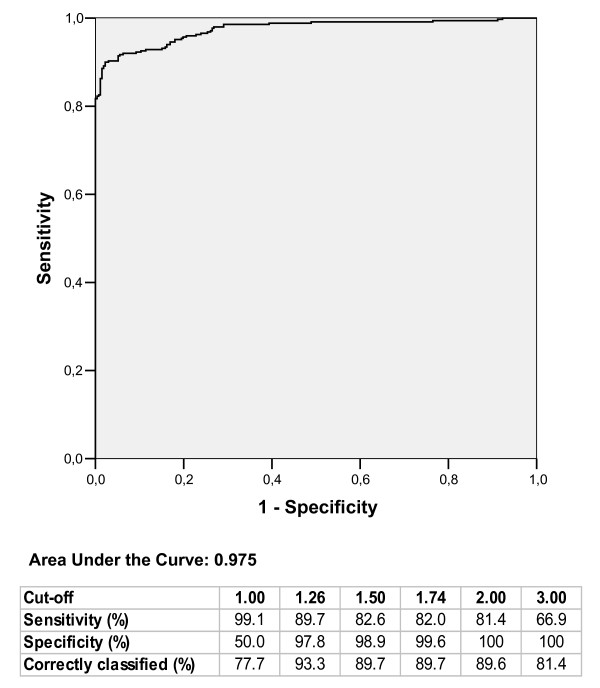
Figure 6.

ROC curve for experiments leaded with known concentration of 8 spike genes. The area under ROC curve gives an estimate of the test accuracy. In the table are reported sensitivity, specificity, and the proportion of correctly classified genes corresponding to the expected ratios of 1, 1.5, 2, 3 and to the optimal thresholds of 1.26 and 1.74 provided by the ROC analysis.
