Figure 7.

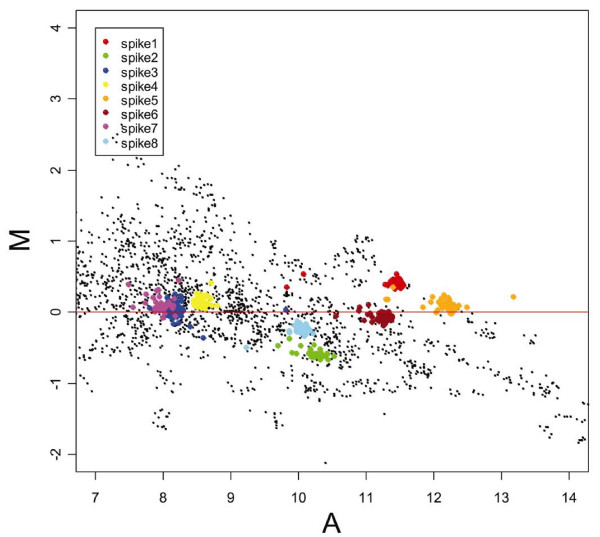
MA-plots of the experimental genes (black dots) and of the spikes (represented with eight different colors) after loess normalization. The spikes are distributed around M = 0 and span about 75% of the range of log-intensity A.

MA-plots of the experimental genes (black dots) and of the spikes (represented with eight different colors) after loess normalization. The spikes are distributed around M = 0 and span about 75% of the range of log-intensity A.