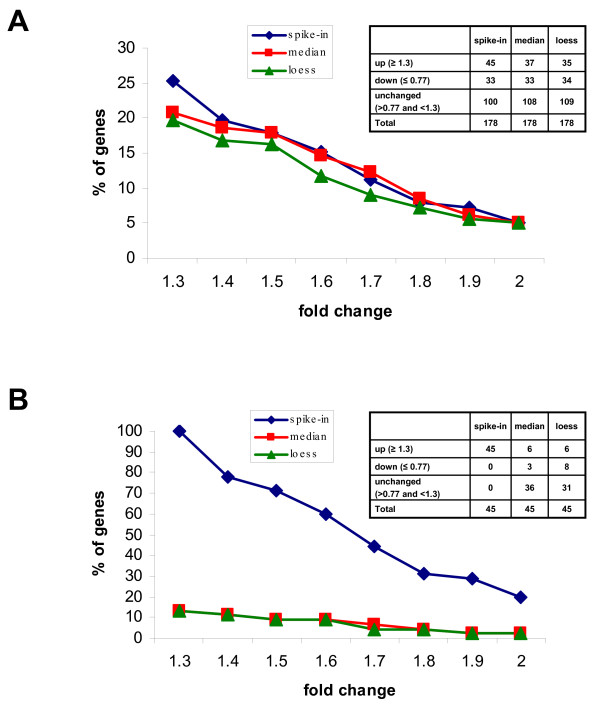
Figure 8.

Effect of different normalization procedures on the detection of modulated genes. RNAs from control or hypoxia -treated macrophage cell line were mixed with the spikes and hybridized to our test-array. Data were filtered (including the outliers removal), normalized with spike-in method (blue line), with the median (red line) or with the loess based on all genes (green line) and scaled. The graphs plot the percentage of genes (Y-axis) having a value equal or greater than that indicated in the X-axis. (A) The analysis was carried on the entire test-array comprising 178 genes symmetrically distributed in up-regulated, down-regulated and not modulated. (B) The analysis was carried on 45 genes having a fold change equal or greater than 1.3 and representing an asymmetric distribution.
