
Figure 2.
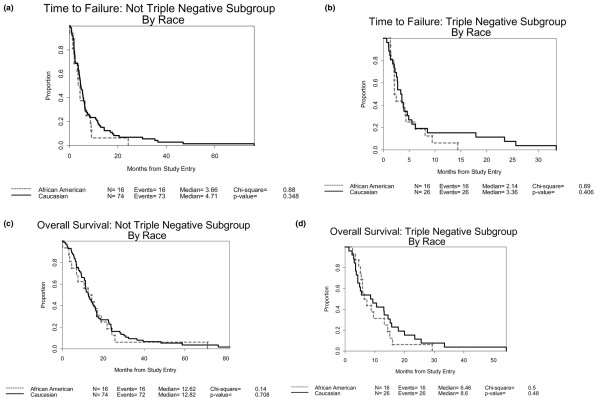
Time to treatment failure and overall survival for triple-negative subgroup, by race. Time to treatment failure: (a) not triple negative and (b) triple negative. Overall survival: (c) not triple negative and (d) triple negative. Patients were classified by race (African-American [dashed line] or Caucasian [solid line]) and divided into subsets based on triple-negative status. Exploratory analysis to investigate the interaction of triple negative status and race.