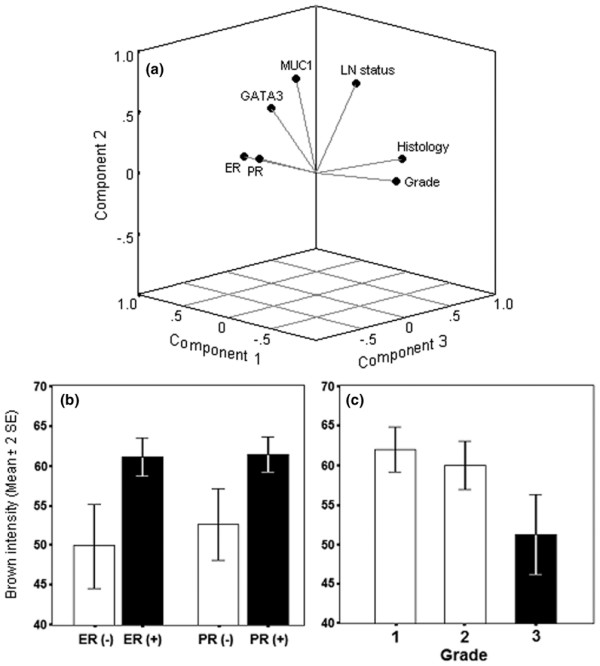
Figure 3.

Tissue microarray analysis of 263 breast normal and cancer tissue samples. (a) Component plot in rotated space showing factors positively correlated, namely estrogen receptor/progesterone receptor (ER/PR; p = 0.0001), ER–PR/GATA3 (p = 0.001), and MUC1/lymph node status (p = 0.006), GATA3/MUC1 (p = 0.01); and factors negatively correlated, namely ER–PR/tumor grade (p = 0.0001) and GATA3/tumor grade (p = 0.002). (b,c) Univariate analysis showing highly statistical association between GATA3 immunostaining and ER and PR status (p = 0.0001) (b) and statistical decrease trend in GATA3 immunostaining and the tumor grade of invasive component (p = 0.004) (c). Results are based on the brown intensity of immunostaining as described in the Materials and methods section, and are shown as means ± 2 SEM.
