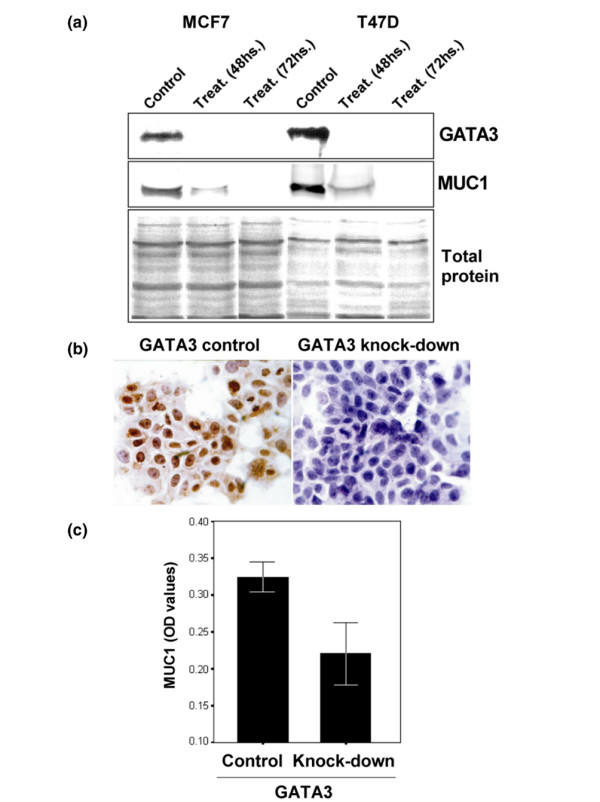
Figure 7.

GATA3 knock-down analysis in MCF7 and T47D breast cancer cell lines. (a) Western blot analysis of GATA3 and MUC1 proteins in non-treated (control) and GATA3 anti-sense treated cells (48 and 72 hours) in both breast cancer cell lines. SDS-PAGE silver protein staining showed equal amounts of total protein loaded. (b) MCF7 immunocytochemistry of GATA3 anti-sense transfected cells showing no immunoreactivity to the anti-GATA3 antibody, and matching control cells show GATA3-positive nuclear localization. (c) Quantification of MUC1 protein expression by MCF7 culture ELISA assay. GATA3 anti-sense treated cells (48 hours) showed a statistically significant decrease in MUC1 expression compared with matched control cells (p = 0.001). Each experiment was performed in triplicate.
