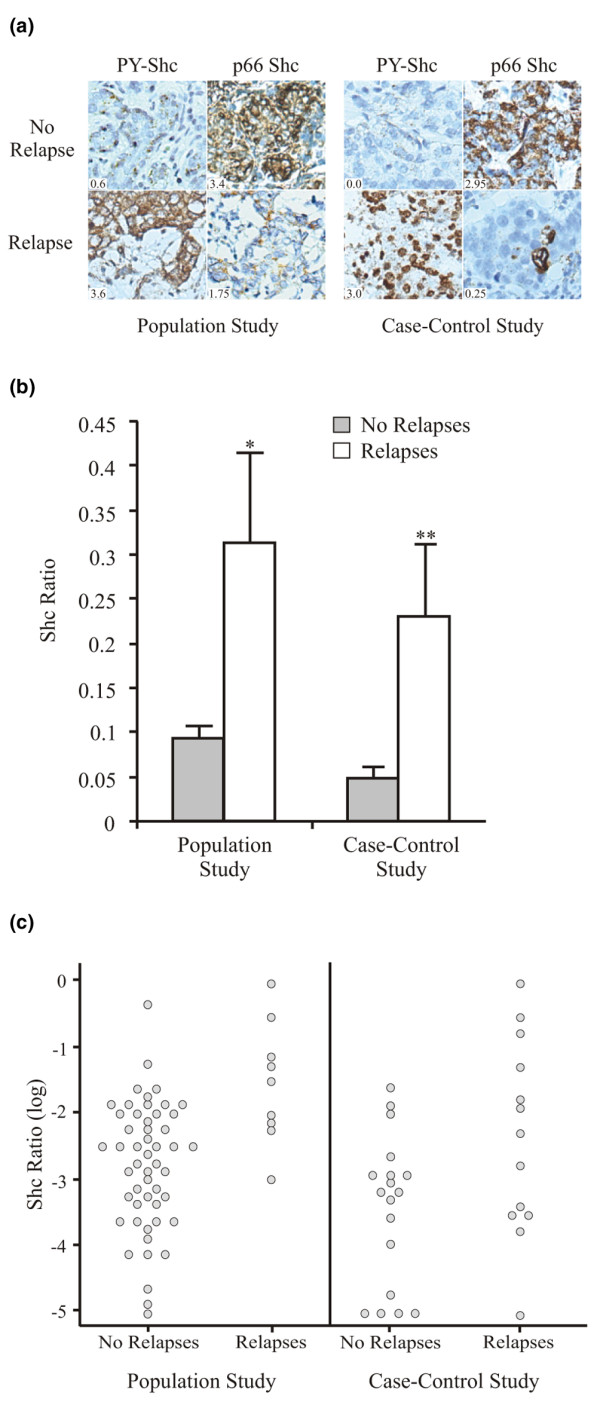
Figure 1.

Comparison of the PY-Shc-to-p66 Shc ratio in primary tumors as a function of disease recurrence. (a) Photomicrographs of PY-Shc and p66 Shc immunohistochemical staining patterns in primary tumors from patients who received tamoxifen and then either relapsed or did not relapse. Shc scores are shown in the insets. The left panel shows the staining patterns of two patients from the population-based cohort, and the right panel shows the staining patterns of two patients from the case-control cohort. Total magnification, ×200. (b) The ratio of PY-Shc to p66 Shc (Shc ratio), scaled 0 to 1, is shown (mean ± standard error) for primary tumors from patients who either relapsed or did not relapse. A comparison of the mean Shc ratios for patients in the population-based study with or without relapses is shown on the left side of the column graph (50 no relapses, 9 relapses; *P = 0.002). A comparison of the mean Shc ratios for patients in the case-control study with or without relapses is shown on the right side of the column graph (18 no relapses, 13 relapses; **P = 0.049). (c) Scatter histograms of the Shc ratio, on a log scale, observed in the patients' primary tumors as a function of relapse in the population-based and case-control cohorts. PY-Shc, tyrosine-phosphorylated Shc.
