
Figure 5.
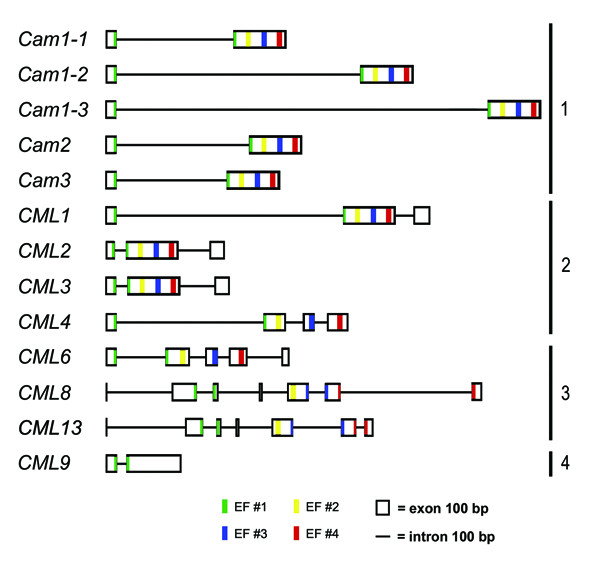
Schematic representation of the OsCam and OsCML genes. Boxes represent exons and lines represent introns. EF-hand motif #1, #2, #3, and #4 are represented by green, yellow, blue and red stripes at their positions, respectively. Groupings of the genes are shown on the right.