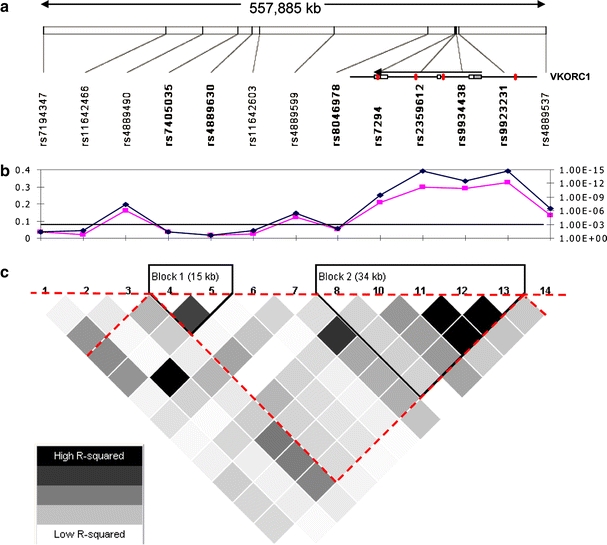
Fig. 2.

Fine mapping of the VKORC1 locus. a Location of SNP markers (MAF ≥ 5%) in a ∼550 kb region surrounding VKORC1 which is coded on the reverse strand and is located at the right end of the LD block. Previously reported SNPs are shown in red (11). b The univariate r2 (pink, left axis) and P-value (blue, right axis) are shown for each SNP. The black line near 10−3 on the right axis indicates the P-value that is necessary to achieve significance after within-gene Bonferroni correction. c HaploView analysis with pair-wise r2 illustrating the extent of LD in the region. The red dotted triangle indicates the LD block defined with data of the HapMap project (CEU panel)
