
Fig. 1.
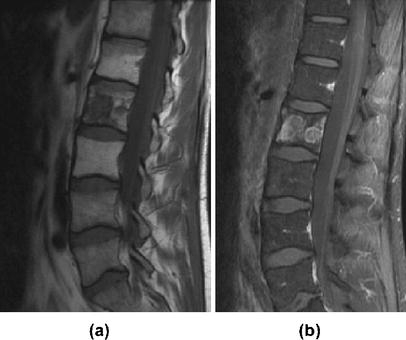
T1-weighted non-enhanced (a) and fat saturated contrast enhanced (b) MR images after radiation therapy of a focal PNET tumor infiltration in L 2. Note the fatty conversion of the bone marrow in the irradiation field, L1 to L3, is only apparent on the non-fat saturated non-enhanced MR image. The tumor in L2 shows a mild Gd-enhancement after radiotherapy on contrast-enhanced scans