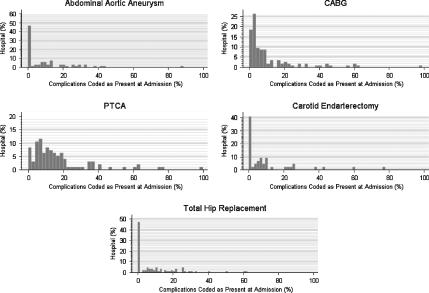
Figure 3.
Hospital Distribution of Condition Present at Admission (CPAA) Modifier for Complication Codes after Omitting Patients with Prior Admissions in 1999–2000
The y-axis represents the percent of hospitals which coded the CPAA modifier as being present at admission as a function of the percent of complications coded as present on admission.

